
Browse Items (13654 total)
Sort by:
A-60-N4
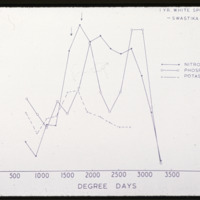
Graph on nutrient uptake rate through degree days in 1 yr White spruce
Fig 6 Oregon (graph)
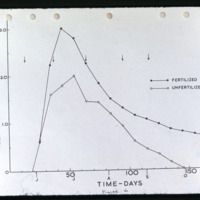
Graph on relative growth rate through time
15JAN65 (graph)
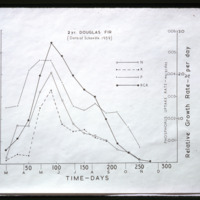
Graph on nutrient intake and relative growth rates through time in 2yr Douglas fir
16JAN65 (graph)
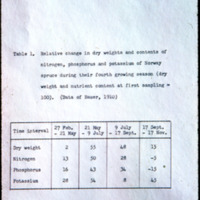
Change in dry weight and nutrient contents in Norway spruce through time
20JUL63 (graph)
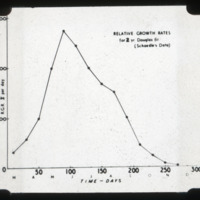
Douglas fir relative growth rate through time (days)
14JAN65 (graph)
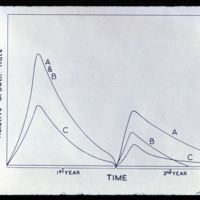
Graph on relative growth rate through time
A61-N1 Fig 7 (graph)
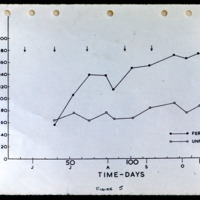
Number of secondary needles through time (difference between fertilized and unfertilized)
11JAN-656 (drawing)
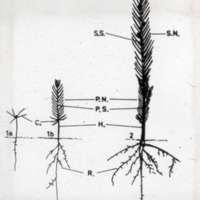
Drawing of the difference on seedlings root length
FIG 4-F+W (Table)
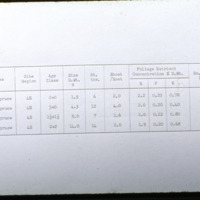
Table on white spruce foliage nutrient concentration
Fig 3 Oregon (graph)
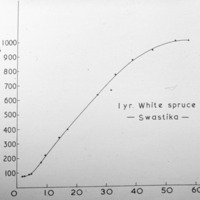
Graph on nitrogen- mg per 1000 seedlings (white spruce)