
Browse Items (13654 total)
Sort by:
Graph Showing Change in Available Phosphorus
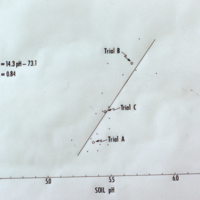
Graph showing change in available phosphorus with increase in pH values. Data from set of trials at Glendon Hall, U of T 1973.
Graph on relative growth rate and net assimilation rate over time (correlation)
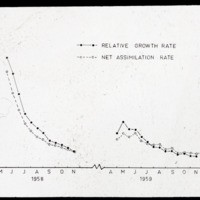
Correlation between two measurements (% and grams per day)
Graph on nutrient uptake rate over time in tree species (Fig 6)
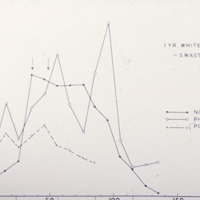
White spruce nutrient intake over days
Graph on mean seedling weight

weight over time?, graph
Graph on growth and temperature relation
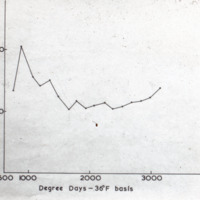
Relative growth rate percentage over a change in temperature
Graph on fertilizer effects on tree height growth over time
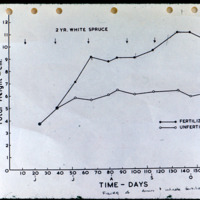
Experiment results
Graph on Douglas fir growth over time
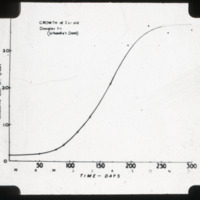
Douglas fir growth (measured through weight change over time) graph.
Graph on change in fertilizer percentage (weight) over time
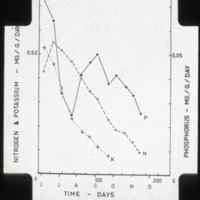
Change in mineral fertilizers weight over time
Graph - depth om x no of burns
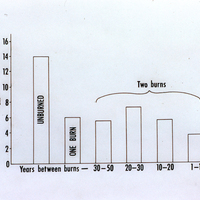
Graphs for Fire Damage Study showing the relationship between the depth of surface organic layers in centimeters and years between burns, years since last fire, and number of observations.
